"Reporting is the fuel that drives companies forward. It is the key to transparency and enables us to chart our course and achieve our goals. Like a captain on a ship, we rely on accurate and meaningful information to choose the best route and arrive safely in the harbour of success. Reporting gives us the confidence that we are on the right track and enables us to optimise our decisions and improve our performance. It's an indispensable tool for any business seeking long-term success."
- Unknown
Interactive reporting and analysis tool - standard reports and standard KPIs.
EcholoN has an interactive reporting and analysis tool with standard reports and standard KPIs for easy and effective data analysis. EcholoN reporting software allows users to monitor their data in real time to gain key insights and intelligence. It provides pre-built reports and key performance indicators based on proven best practices, and allows users to create custom reports and dashboards to meet their specific needs. The EcholoN Reporting Tool gives companies the ability to visualise their data clearly and accurately and make informed decisions.
- Reports and exports can be automated. Users can set schedules to automatically generate reports and export them to formats such as Excel or PDF.
- Interactive dashboards are associative, meaning that when a selection is made in one chart, the other charts adjust to the selection as needed.
- In list or pivot views, you can navigate directly by double-clicking on the selected "underlying data sets". Further analysis can thus take place directly "at the source".
- Standard reading models are available as a "warehouse". Standard statistics are posted on the system side and are accessible at each object with corresponding movement data.
- Key figures such as response time, resolution time, SLA complied with, escalation level, throughput time are thus booked directly for each process and can be called up via the reading model. The booking is also made on the basis of and in consideration of time schedules and holidays
Interactive dashboard customers by selection type incident:
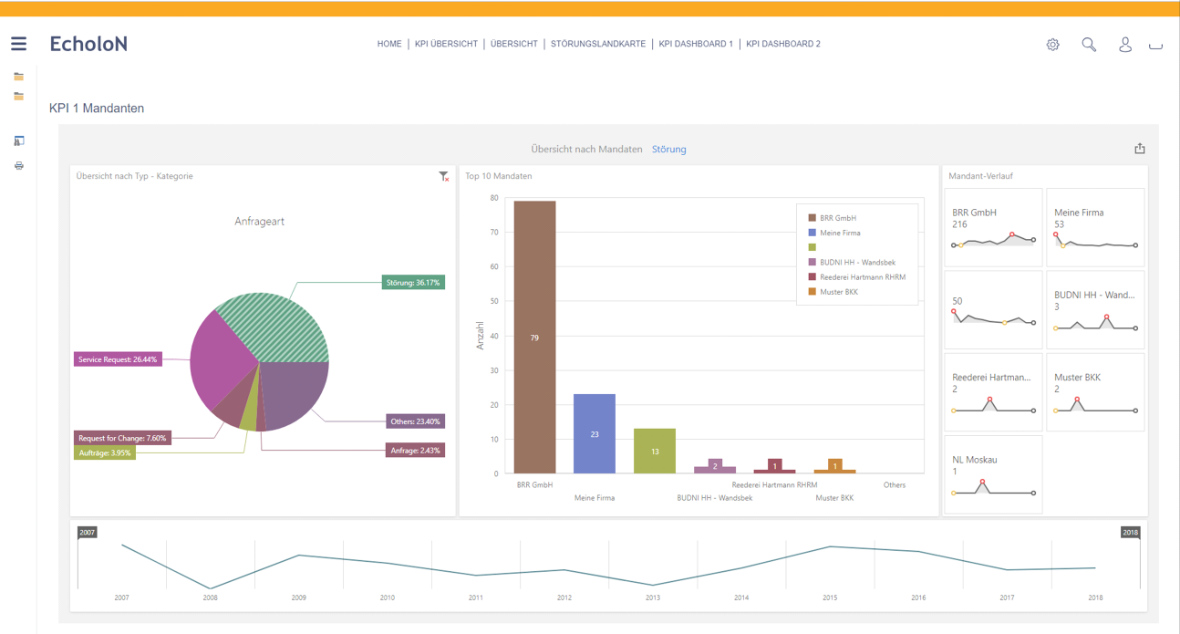
Overview of the incident history by organisational unit (client / customer) by year
Interactive dashboard CIs under repair by manufacturer:
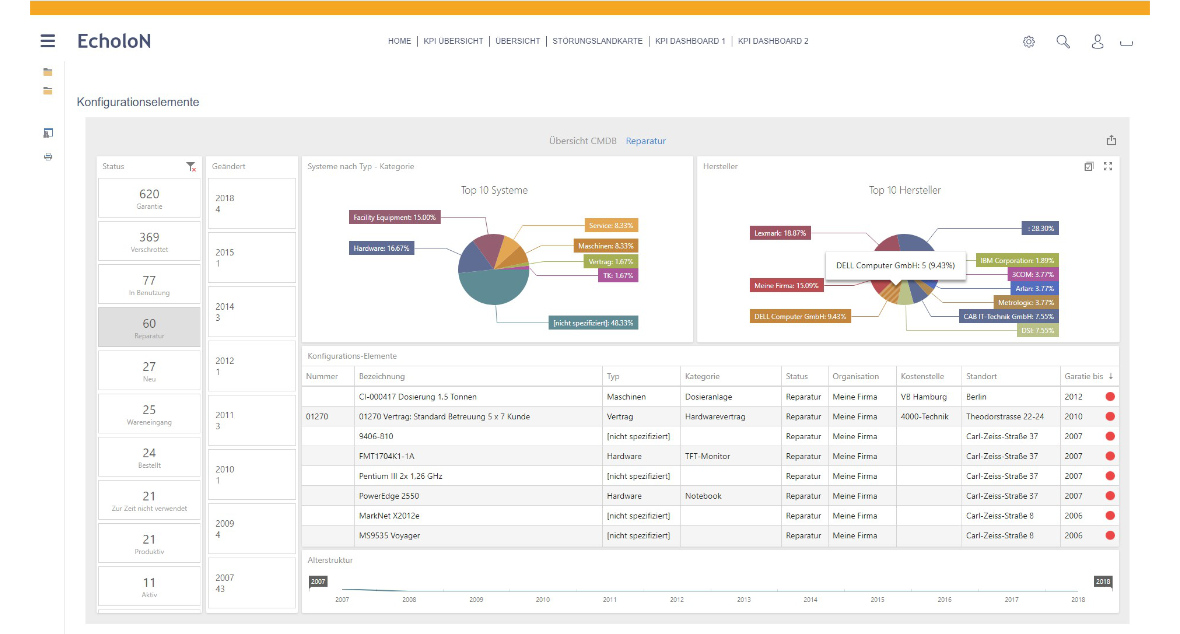
Accentuating colours here indicate, for example, whether there is still a guarantee for the appliance to be repaired.
Interactive Dashboard KPI 1 Overview Ticket / Operations:
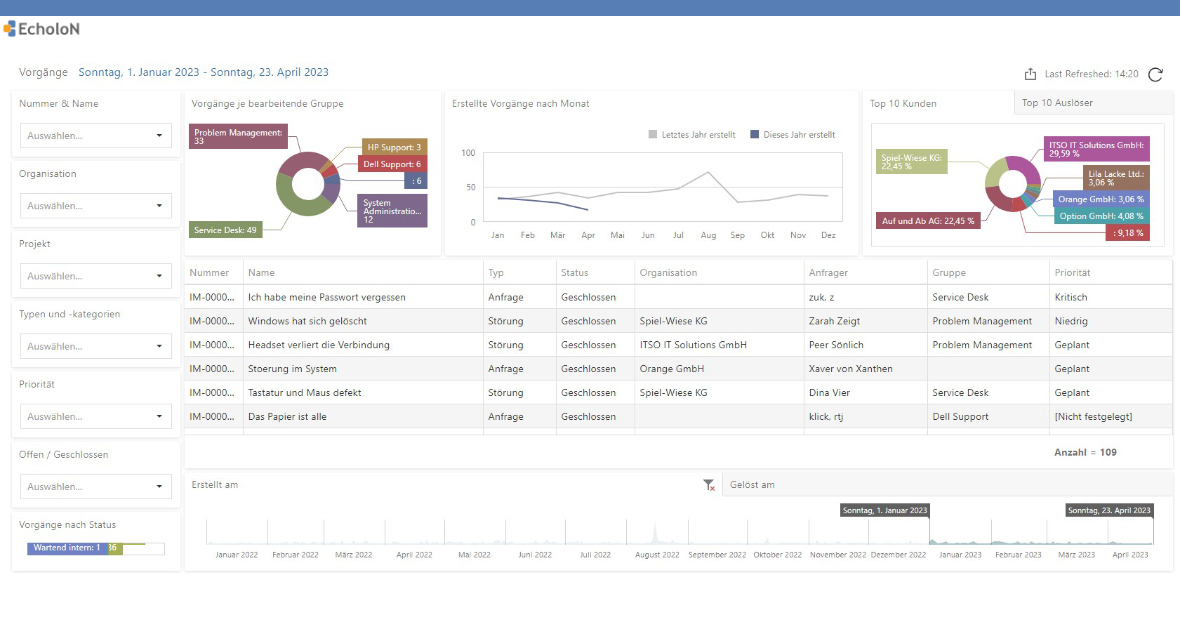
The top "10 customers" and "top 10 triggers" data result from the different organisations as requesters. The triggers are CMBD elements entered in the ticket.
Interactive Dashboard KPI 2 Overview Ticket Statistics:
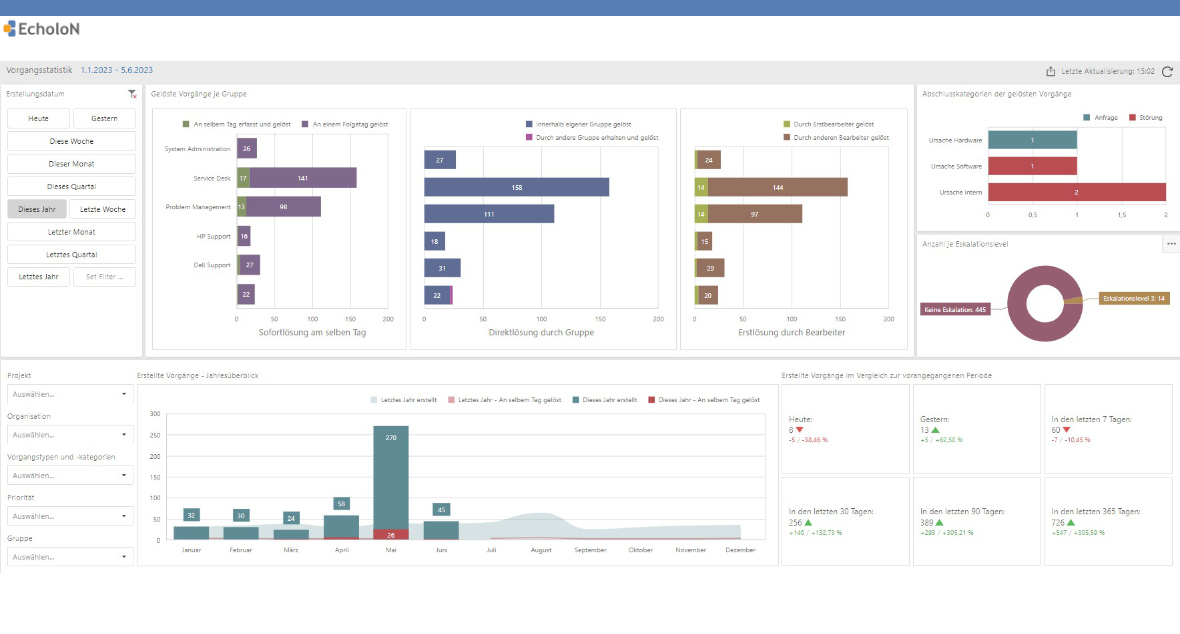
- Operations created by previous year / year
- Created tasks Today/Yesterday/Last 7 days/Last 30 days/Last 90 days/Last 365 days
- Closed activities by activity group
- View of closure categories used
- View of escalation levels in progress
Interactive dashboard KPI 3 Ticket processing times:
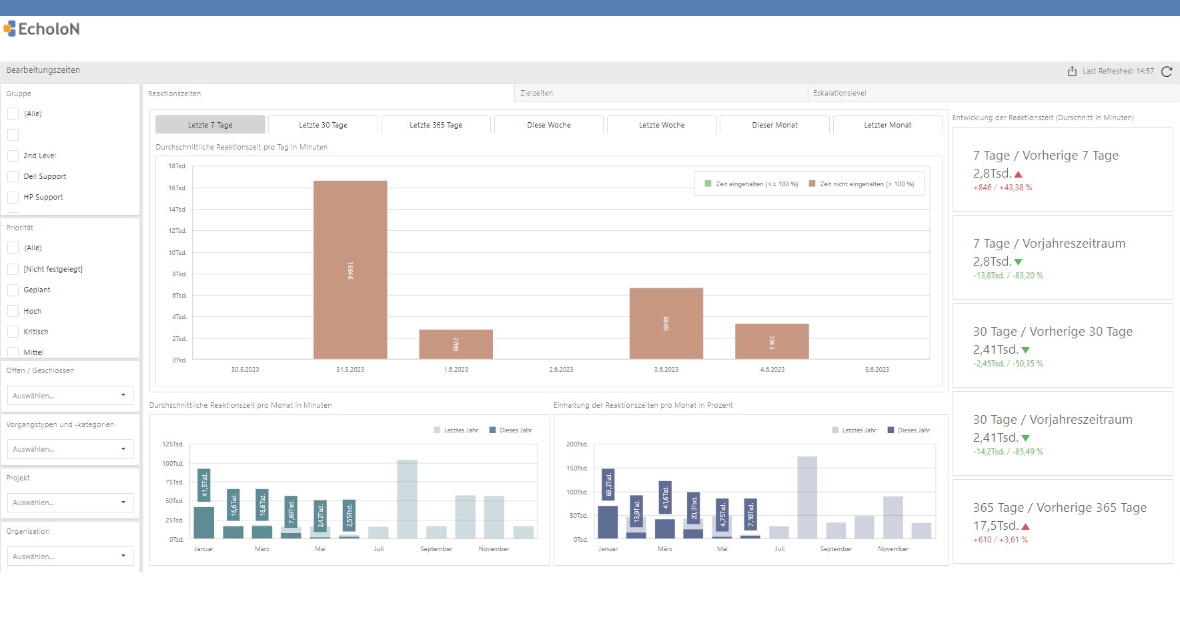
- Reaction times
- Target times ( resolution times)
- Escalation level
The determination of the response time depends on the priority of the process. The display provides values when working with the indicator "Set reaction time" via the first processing status or with the standard setting: Reaction time = e.g. mail receipt - ticket created _on.
The reaction time from the priority (in min) is compared with the determined reaction time (in min) from one of the two standard variants.
The target time depends on the priority of the process. It is the target time within which a task should be solved.
Interactive Dashboard KPI 4 Asset Overview:
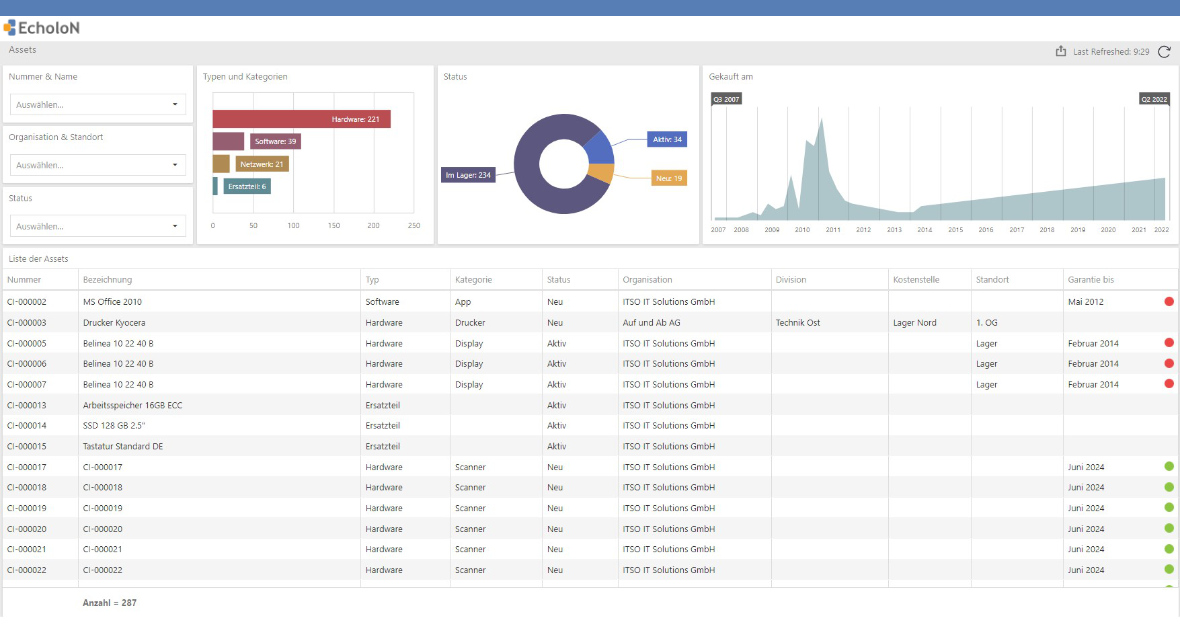
Overview of all configuration items (CI):
The assets represent all CMDB items. You can see the status, the types and when an item was purchased. Maintained warranty data is marked in colour if the warranty date is in the past with a red dot. If the warranty date is in the future, this is indicated by a green dot.
The transaction types are shown in the display. The number per type is made over all CIs without restriction to the categories.
Interactive dashboard KPI 5 Knowledge base usage and rating overview:
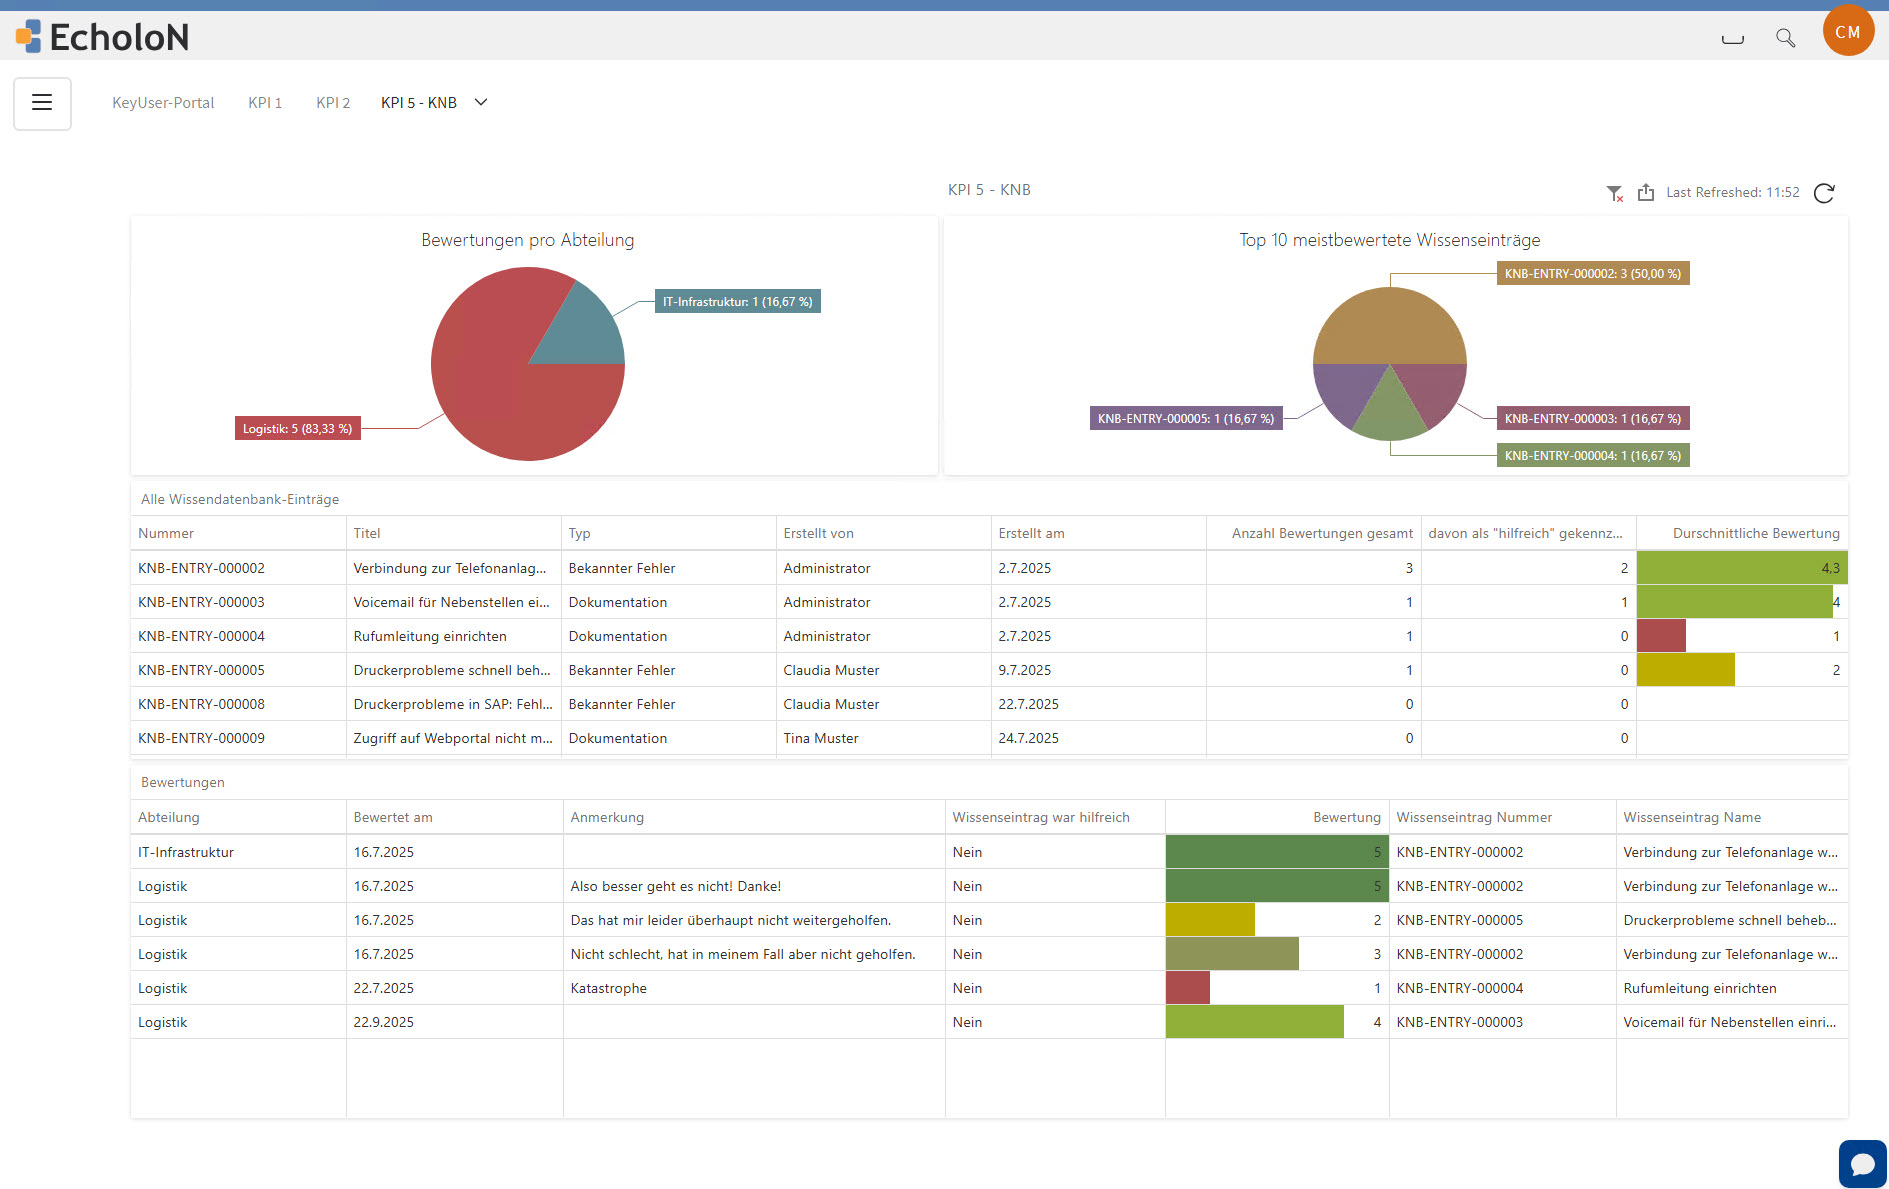
Overview of the usage and rating of knowledge base entries by department
Display of the TOP 10: most highly rated knowledge entries
Example: Administration of an interactive dashboard with the setting of report objects:
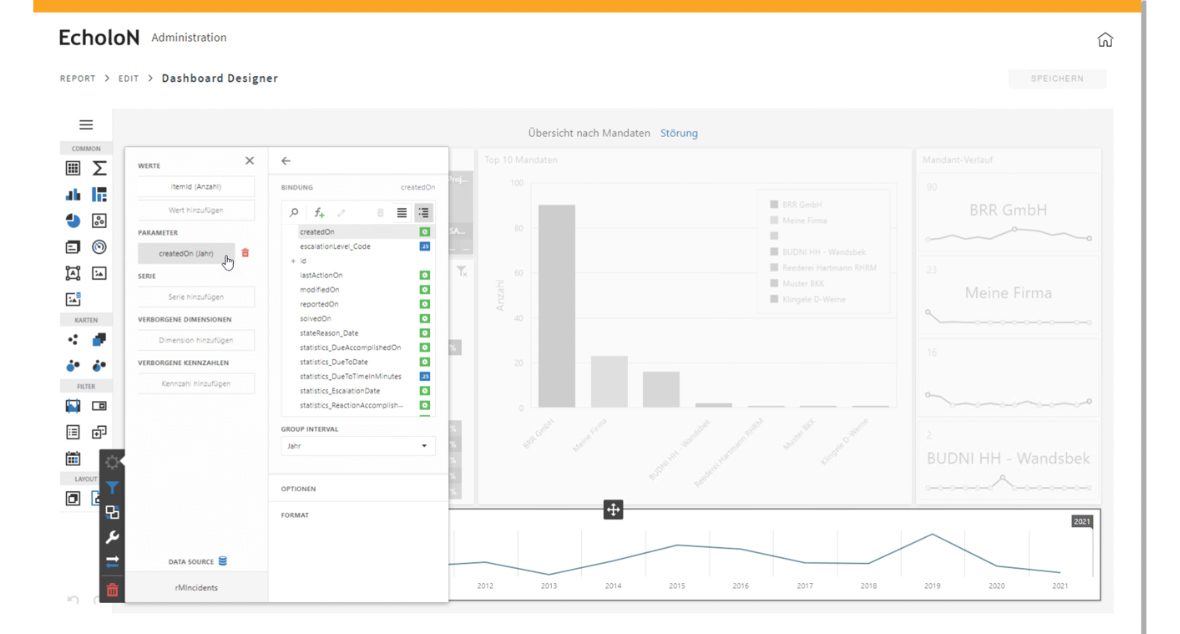
Adaptation of the customer - area filter "History capture"
The following advantages are offered by the use of EcholoN Reporting and Analysis Tool:
- Real-time monitoring: EcholoN enables real-time monitoring of data to provide key insights and intelligence.
- Standard reports and standard KPIs: The tool provides pre-built reports and KPIs based on proven best practices.
- Custom reports and dashboards: Users can create custom reports and dashboards to meet specific needs.
- Clear and concise data visualisation: The tool visualises data in a clear and concise manner to present complex information in an understandable way.
- Informed decisions: EcholoN provides key information and metrics that serve as the basis for informed decisions.
- Time saving: The automation of report generation saves time and effort.
- Efficient data analysis: EcholoN facilitates data analysis and enables companies to identify trends and patterns.
- Transparency and traceability: EcholoN provides transparency and enables traceable documentation of report data.
- Improved communication: The clear visualisation and professional structure of the reports enable companies to communicate information effectively to stakeholders.
- Scalability: EcholoN can be used for small companies as well as for large companies with extensive data sets.
Also interesting:
- Blog article: What is SLA monitoring for business services?
- Blog article: What do the fault or incident metrics MTBF, MTTR, MTTA and MTTF mean?
- Blog article: Measuring customer satisfaction (CSAT)?
- Blog article: Maintenance and repair – relevant key performance indicators (KPIs)
- Blog article: Actual analysis explained simply: The actual status in project management